Skip to content

Bicycle crashes in Arizona rose for a fifth straight year in 2025, reaching 1,634, up 16% from 2024, even as total crashes statewide fell 4.5%, according to a Harris Injury Law analysis of Arizona Department of Transportation (ADOT) crash data. The sharpest change was among young riders: the number of bicyclists aged 10 to 14 killed or injured nearly doubled in a single year, and most of that rise came from three East Valley cities.
The timing matters. October has been Arizona’s busiest month for bike crashes in four of the last five years, so the season these numbers describe is starting now.
Key Findings
- Arizona recorded 1,634 bicycle-involved crashes in 2025, up 16.3% from 1,405 in 2024 and up 54% from 1,063 in 2021. Bike crashes rose every year from 2021 to 2025.
- Total crashes in Arizona fell 4.5% in 2025, from 123,538 to 117,932. Bike crashes rose more than any other crash category on ADOT’s statewide summary.
- Bicyclists aged 10 to 14 killed or injured in Arizona crashes nearly doubled in 2025, from 115 to 217, after staying between 91 and 115 a year from 2021 to 2024.
- Gilbert, Chandler and Mesa together went from 34 to 89 young riders (aged 10 to 14) killed or injured, 64% of Maricopa County’s increase. In Gilbert, 44% of the bicyclists hurt in 2025 were aged 10 to 14.
- Tempe had the highest bike crash rate of the Arizona cities analyzed in 2025: 63.5 crashes per 100,000 residents, about three times the statewide rate of 21.4.
- Crashes in the dark involved 20% of bicyclists killed or injured in Arizona from 2021 to 2025, but 44% of bicyclists killed (95 of 217).
- Bicyclist deaths fell to 33 in 2025, the lowest in five years, while serious injuries rose every year, from 142 in 2021 to 197 in 2025.
How much have bike crashes risen in Arizona?
Bicycle-involved crashes in Arizona have risen every year since 2021, from 1,063 to 1,634, an increase of 54%. The 2025 jump of 229 crashes was the largest one-year rise in that period.
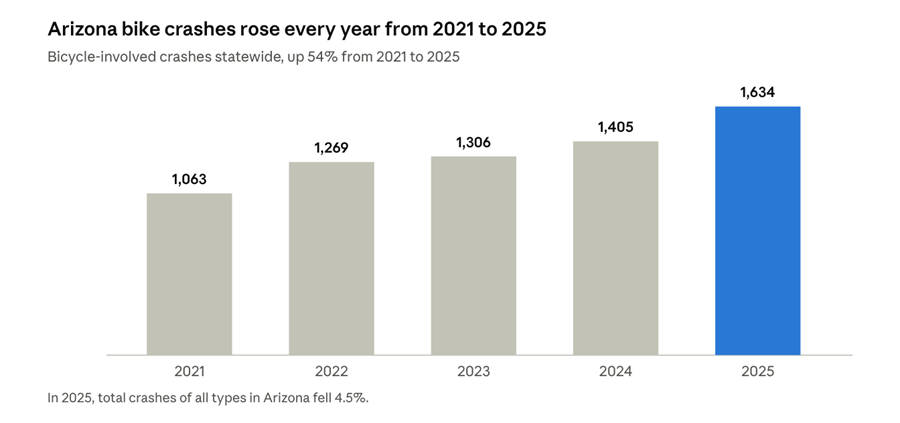
ADOT Crash Facts dashboards, Bicycle tab, 2021 to 2025 (pulled Oct. 14, 2026)
What makes 2025 stand out is that it moved against everything else on the road. Total crashes fell 4.5%, from 123,538 to 117,932. Of the six crash categories on ADOT’s statewide summary, only two rose, and bike crashes rose the most:
| Crash category | 2024 | 2025 | Change |
| Bicyclist-involved | 1,405 | 1,634 | +16.3% |
| Wet road surface | 5,204 | 5,922 | +13.8% |
| Impairment-involved | 6,592 | 6,347 | -3.7% |
| Pedestrian-involved | 2,091 | 1,993 | -4.7% |
| Speeding-involved | 39,869 | 37,418 | -6.1% |
| Motorcycle-involved | 3,133 | 2,919 | -6.8% |
| All crashes | 123,538 | 117,932 | -4.5% |
The severity pattern is mixed. Bicyclists seriously injured rose every year, from 142 in 2021 to 197 in 2025. Bicyclists killed fell to 33 in 2025, the lowest of the five years, down from 44 in both 2023 and 2024. More crashes and more serious injuries alongside fewer deaths suggests more riders are getting hurt, but a smaller share of crashes are fatal. The crash records alone don’t say why.
Who is getting hurt?
The biggest change in 2025 was among children and young teens. Bicyclists aged 10 to 14 killed or injured statewide went from 115 in 2024 to 217 in 2025.
| Year | Bicyclists aged 10 to 14 killed or injured, Arizona |
| 2021 | 91 |
| 2022 | 109 |
| 2023 | 104 |
| 2024 | 115 |
| 2025 | 217 |
This was not a long, steady climb. The count held between 91 and 115 for four years, then nearly doubled in one. That pattern points to something that changed recently rather than a slow trend. Riders aged 10 to 14 made up 13% of all bicyclists killed or injured in Arizona in 2025.
At the other end of the age range, the risk is different. Riders 65 and older were about 11% of bicyclists killed or injured in 2024 and 2025, but 34% of those killed (26 of 77). Older riders are a small share of those hurt but a third of those killed.
Age profiles also vary sharply by city. In Tempe, riders aged 20 to 34 made up 58% of the bicyclists hurt in 2025, while riders aged 10 to 14 were almost absent (2 of 123). In Gilbert, it was nearly the reverse.
Where did the increase happen?
Most of it happened in Maricopa County, and within the county, mostly outside Phoenix. Maricopa County is home to 62% of Arizonans but had 71% of the state’s bike crashes in 2025 (1,164 of 1,634). Its bike crashes rose 16.8%. Phoenix rose 10.4%, while the rest of the county rose 19.7%, from 681 crashes to 815.
The young-rider jump is even more concentrated. Maricopa County’s count of bicyclists aged 10 to 14 killed or injured doubled, from 87 to 173. Gilbert, Chandler and Mesa accounted for 55 of that 86-rider increase. Phoenix added four.

ADOT Crash Facts dashboards, Bicycle tab, filtered by city, 2024 and 2025 (pulled Oct. 14, 2026)
Gilbert’s numbers stand out most. Its bike crashes rose 73% in one year, from 48 to 83, the fastest growth of any city analyzed. Of the 88 bicyclists killed or injured there in 2025, 39 were aged 10 to 14, more than in Phoenix (23), a city with nearly six times Gilbert’s population. Families in that area can find local information on our Gilbert bicycle accident page.
Raw counts favor big cities, so the table below also shows crashes per 100,000 residents.
| City | Bike crashes, 2024 | Bike crashes, 2025 | Change | Crashes per 100,000 residents, 2025 | Bicyclists killed or seriously injured, 2025 |
| Tempe | 108 | 121 | +12% | 63.5 | 6 |
| Mesa | 153 | 202 | +32% | 39.3 | 37 |
| Scottsdale | 71 | 73 | +3% | 30.0 | 11 |
| Gilbert | 48 | 83 | +73% | 28.9 | 6 |
| Glendale | 79 | 73 | -8% | 28.0 | 13 |
| Chandler | 55 | 71 | +29% | 25.5 | 6 |
| Peoria | 40 | 45 | +13% | 22.4 | 1 |
| Tucson | 124 | 119 | -4% | 21.7 | 18 |
| Phoenix | 316 | 349 | +10% | 21.0 | 46 |
| Maricopa County | 997 | 1,164 | +17% | 24.8 | 149 |
| Arizona | 1,405 | 1,634 | +16% | 21.4 | 230 |
Three things stand out in the table:
- Tempe has the highest crash rate by a wide margin, about three times the statewide rate. Population counts residents, not riders, so a city where many people bike will show a higher rate partly because more people are on bikes. The rate shows where crashes concentrate, not necessarily where each ride is most dangerous.
- Mesa’s crashes are more severe. Mesa had 37 bicyclists seriously injured in 2025, one more than Phoenix, with fewer than 60% of Phoenix’s crashes. About 18% of bicyclists hurt in Mesa were seriously injured, compared with about 10% in Phoenix.
- The rise did not reach every city. Tucson and Glendale both had fewer bike crashes in 2025 than in 2024, and Scottsdale was nearly flat. The growth was centered in the East Valley.
When are riders most at risk?
Fall is the peak season. October was Arizona’s busiest month for bike crashes in 2021, 2022, 2024 and 2025. In 2023, September edged it out, 133 crashes to 128. In 2025, October had 179 bike crashes statewide, and October through December together accounted for 30% of the year’s total.
June was the quietest month in both 2024 and 2025. The pattern fits Arizona’s climate, with fewer crashes in the hottest months and more as temperatures ease, though the crash records don’t measure how many people are riding.
Late afternoon is the busiest time of day. About a quarter of bike crashes in both 2024 and 2025 happened between 3 and 6 p.m. (26.8% and 26.4%).
Darkness is where riders die. Over the five years from 2021 to 2025, crashes in the dark made up a small share of injuries but a large share of deaths:
- Bicyclists hurt: about 1 in 5 were hit in the dark (1,373 of 6,797, or 20%).
- Bicyclists killed: close to half were hit in the dark (95 of 217, or 44%).
The pattern repeats every year. Most crashes happen in daylight, but a crash after dark is far more likely to be fatal.
Phoenix shows the darkness pattern even more sharply. In both 2024 and 2025:
- Bicyclists hurt: about 1 in 5 were hit after dark on a lit street (20% to 24%).
- Bicyclists killed: 6 in 10 were hit after dark on a lit street.
Where Arizona should focus next
Crash records show where, when and to whom bike crashes happen. They don’t show why. Read together, though, the numbers point to a handful of places where attention would likely do the most good.
- Visibility after dark. Dark conditions account for about one in five bicyclists hurt but close to half of those killed. In Phoenix, most of those deaths happened on lighted streets. That points to visibility for both riders and drivers, not just street lighting, as the issue to examine.
- Young riders in the East Valley, before the fall peak. The jump in riders aged 10 to 14 was concentrated in Gilbert, Chandler and Mesa, and it arrived after four flat years. Because October is the peak month, late summer and early fall look like the right window for youth bike-safety efforts, school-route reviews and conversations with families in those cities.
- Count e-bikes separately. ADOT’s public crash dashboard does not report e-bikes apart from conventional bicycles. Without that detail, nobody can say from the public data whether e-bikes are part of the rise among young riders. Recording it would turn a guess into an answer.
- Severity in Mesa. Mesa’s share of bicyclists seriously injured is nearly twice Phoenix’s. A closer look at where Mesa’s most serious crashes happen, and on what kinds of roads, could explain the gap.
- Ridership counts in Tempe. Tempe’s rate is the highest of the cities analyzed, but rates per resident can’t separate a dangerous place from a busy one. Counting how many people actually ride would show whether Tempe’s riders face more risk per trip or simply make more trips.
- Older riders. Riders 65 and older are about one in ten bicyclists hurt but one in three killed. Even a small number of crashes in this group carries a high cost.
The full city and county table is included above for anyone who wants to look at their own community’s numbers.
If you or your child is hurt in a bike crash
In Arizona, a personal injury lawsuit generally must be filed within two years after the claim accrues (A.R.S. § 12-542). For a child, the time before they turn 18 generally does not count toward that deadline (A.R.S. § 12-502). A rider who was partly at fault can still recover, with the award reduced by their share of fault, as explained in our guide to Arizona’s comparative fault law. Harris Injury Law handles bicycle accident claims across Arizona. Riders and families with questions about a crash can request a free consultation.
Methodology
- Crash figures come from ADOT’s annual Crash Facts dashboards for 2021 to 2025 (Bicycle and Overview tabs), filtered by county and city where noted, pulled Oct. 14, 2026. “Bike crashes” are ADOT’s bicycle-involved crashes; age, light and injury figures count bicyclists killed or injured. “Dark” combines dark-lighted, dark-not-lighted and dark-unknown-lighting conditions.
- Rates use U.S. Census Bureau population estimates for July 1, 2025. ADOT updates its dashboards as reports are revised, so some figures differ slightly from ADOT’s August 2026 news release (for example, 1,634 bike crashes in 2025 on the dashboard against 1,640 in the release).
- Small counts for single cities, especially deaths, can change a lot from year to year and should be read with care.
Sources
- Arizona Department of Transportation – Arizona Motor Vehicle Crash Data, annual dashboards https://azdot.gov/planning/traffic-safety/arizona-motor-vehicle-crash-facts
- ADOT Crash Facts Summary 2025 dashboard – 2025 statewide, county and city figures https://azdot.aashtowaresafety.net/crash-facts-summary-2025
- ADOT Crash Facts Summary 2024 dashboard – 2024 statewide, county and city figures https://azdot.aashtowaresafety.net/crash-facts-summary-2024
- ADOT Crash Facts Summary 2023 dashboard – 2023 statewide figures https://azdot.aashtowaresafety.net/crash-facts-summary-2023
- ADOT Crash Facts Summary 2022 dashboard – 2022 statewide figures https://azdot.aashtowaresafety.net/crash-facts-summary-2022
- ADOT Crash Facts Summary 2021 dashboard – 2021 statewide figures https://azdot.aashtowaresafety.net/crash-facts-summary-2021
- ADOT news release, Aug. 27, 2026 – Traffic fatalities on Arizona roads decline for third year in a row https://azdot.gov/news/traffic-fatalities-arizona-roads-decline-third-year-row
- U.S. Census Bureau QuickFacts – Population estimates, July 1, 2025 (V2025), for Arizona, Maricopa County and each city listed https://www.census.gov/quickfacts/fact/table/AZ/PST045225
- Arizona Legislature – A.R.S. § 12-542, two-year limitation for personal injury actions https://www.azleg.gov/ars/12/00542.htm
- Arizona Legislature – A.R.S. § 12-502, effect of minority on limitation periods https://www.azleg.gov/ars/12/00502.htm
Media note
Journalists may use these figures with a link to this page.
This article is for general informational purposes only and is not legal advice. Reading it does not create an attorney-client relationship.